Meridian DFT – Multimode Design for Testability
Multimode Design for Testability (DFT) Static Sign-off
Meridian DFT is a high capacity, multimode DFT static sign-off tool, which runs a comprehensive set of DFT rules to rapidly identify RTL and gate-level design violations to help designers improve scan testability and coverage.
Meridian DFT can be used for continuous DFT sign-off through completion of place & route:
- During RTL design — to fix asynchronous set/reset, clock and connectivity issues early
- After scan synthesis — to check for scan chain rule compliance
- Following place & route – to assess & correct issues with scan chain reordering or netlist modification
Some of Meridian DFT’s unique characteristics enable designers to prepare their RTL and gate-level designs for the highest possible quality ATPG pattern generation and silicon success.
- Multimode DFT, to check multiple sets of rules in a single run, reducing setup time, speeding up runtime, and accelerating debug
- High capacity, to handle multimillion-gate designs in minutes with a low peak memory footprint
- Comprehensive, fine-grained rules, to ensure high coverage at all design stages and help accelerate debug and root cause analysis
- Low noise, minimize false positives and error duplication
- Fast setup, which takes only hours instead of the weeks required with other DFT static tools
- Fits easily with existing flows and DFT/ATPG tools
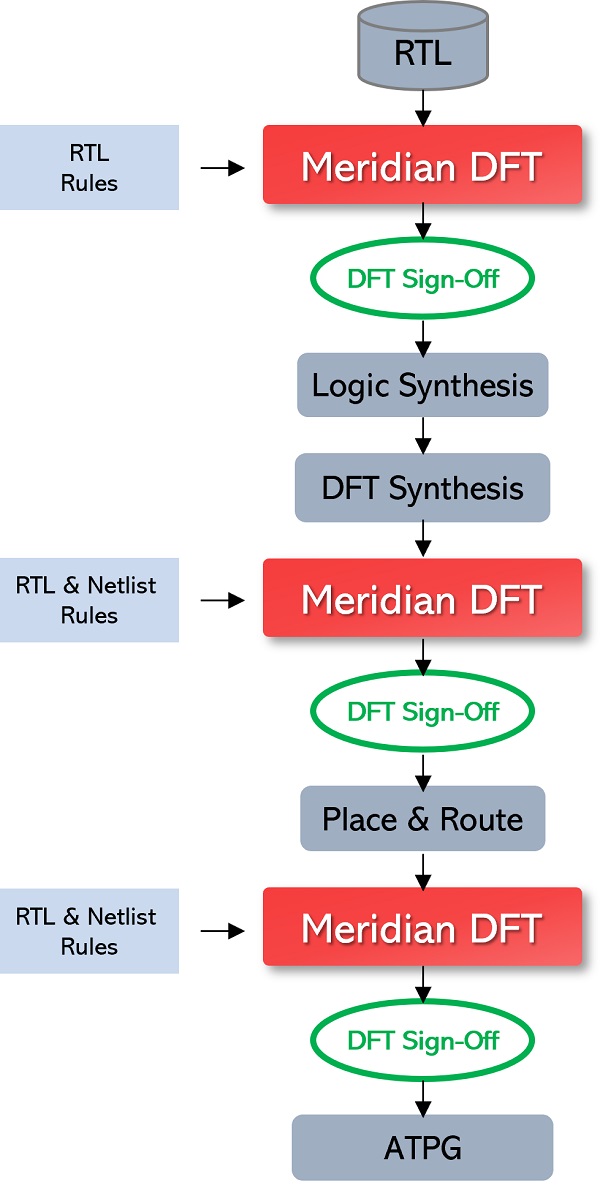
Continuous DFT static sign-off, beginning early in the RTL flow.
Multimode Reduces DFT Static Sign-off by Weeks
By checking multiple sets of rules in a single run, Meridian DFT can reduce static sign-off time by several weeks.
There are three key aspects to Meridian DFT’s multimode capabilities that reduce setup times, speed up runtime, and decreases the time spent debugging and fixing violations by generating one high-precision, organized report of all the test modes.
In a single multimode run, the tool can support:
1. Multiple ATPG partitions. Meridian DFT saves substantial time by verifying multiple ATPG partitions in each run, eliminating the time-consuming process of running DFT static sign-off for each partition, with each partition requiring its own test mode.
2. Multiple constraint-sets. Meridian DFT verifies design for testability sign-off rules for multiple sets of design constraints in one run. Each constraint set corresponds to the types of ATPG patterns — such as uncompressed, compressed, diagnostic, connectivity.
3. Multiple constraint-sets across multiple test modes. The combination of the first two capabilities gives designers the flexibility to verify multiple constraint-sets across multiple test modes, in a single run.
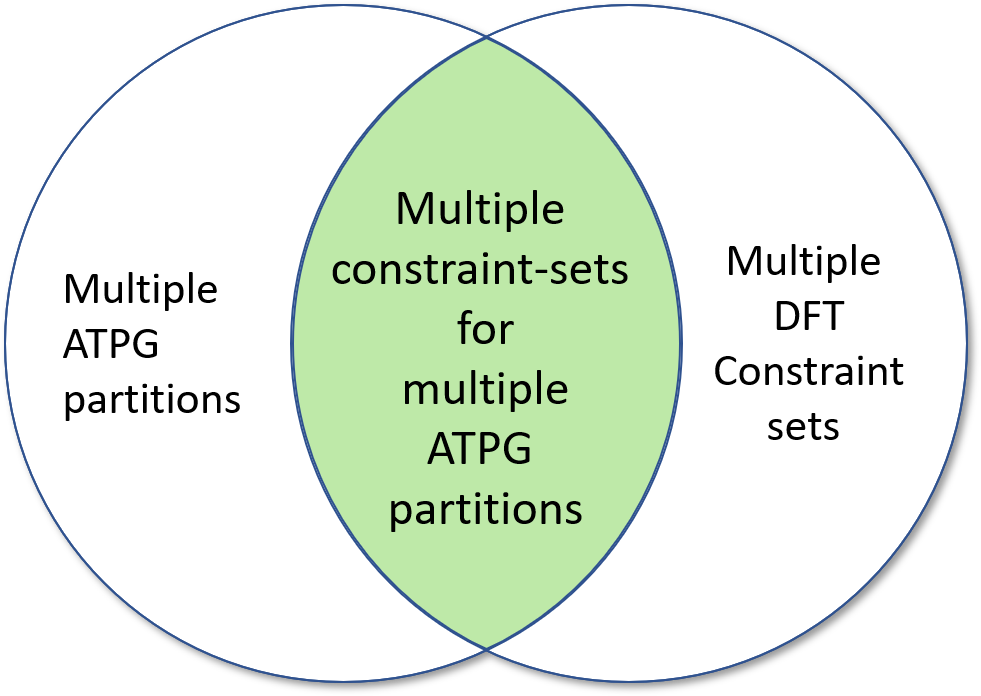
Multimode DFT static sign-off reduces setup, runtime & debug
High coverage, Fine-grained Rulesets
High Coverage Rulesets
Real Intent Meridian DFT has extremely high coverage rule sets to ensure robust analysis for:
- Asynchronous Sets & Resets
- Clocks
- Scan chains
- Individual flip-flops
- Modules
- Input/output ports
- IEEE 1500 wrapper boundary to I/O port connectivity
- General-purpose connectivity
Fine-grained Rules
Meridian DFT splits general requirements into multiple fine-grained rules for accurate reporting and ease of debug.
The fine-grained rules accelerate debug and root cause analysis by allowing faster identification of specific, actionable design fixes. The rules can be applied in a global context as well as in the context of specific test modes for multimode runs.
Some examples are fine-grained rulesets for:
- Reset glitches, such as two different glitch sources converging and a glitch source re-converging with itself, with opposite polarity.
- Lockup latches within scan chains, for example: Lockup latch is present, lockup latch has correct enable signal, lockup latch has correct polarity, and lockup latch is redundant.
- Specialized rules for sequential capture through loops and deep sequences of flip-flops without scan collars, controllability and observability through memories, and advanced connectivity checks.
Rule Selection & Configurability by Test Mode
Selectively Enable Rules
The rules can be selectively enabled in every test mode, such that the different test modes can each have different rules enabled. This gives users the flexibility to do specific checking for different test modes, such as connectivity.
Configurable Rule Severity
Severity is also configurable by test mode. Design engineers can specify that one particular rule is an error in one test mode, while designating the same rule as only a warning or information-only in other test modes.
Meridian DFT Resources
 Datasheet
 White Paper
Precise, Low Noise Violation Reports
Precise Violation Reports
Meridian DFT produces a low noise violation report. The tool achieves this by:
- Performing accurate and detailed design analysis before reporting the violations, reducing false positives.
- Accurate root cause analysis and grouping for violations, eliminating duplication in the violations reported for each rule.
- Fine-grained rules reduce overlap between rules, substantially reducing duplicate violation reporting between different rules.
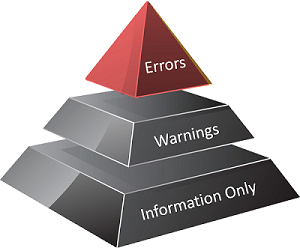
Tiered Violation Severity
Meridian DFT organizes the violations in tiered priority order, providing guidance to help designers more quickly pinpoint the root cause.
The tiers are “errors”, “warnings” and “information-only”; the last tier allows designers to also provide useful information about the cells on each scan chain to designers. The rule severity can be set as appropriate.
Hierarchical Violation Categorization
Meridian DFT’s violation reporting lets you hierarchically categorize the violations by:
- Rule — Specific violation types to check
- Tiered Rule Group — Rule violation instances grouped & categorized by rule category, severity level, & test mode.
- Policy/Violation Status — Container with multiple rule groups
Groups of related violations are shown in single report item. The group violations can then be toggled to expand or collapse.
If a root cause is identified, the violations associated with that root cause are grouped together. For example:
- Violations associated with a gated test clock reaching a flop are grouped by the clock gating instance.
- Violations associated with reset glitches are grouped by the convergence instance of the glitch sources.
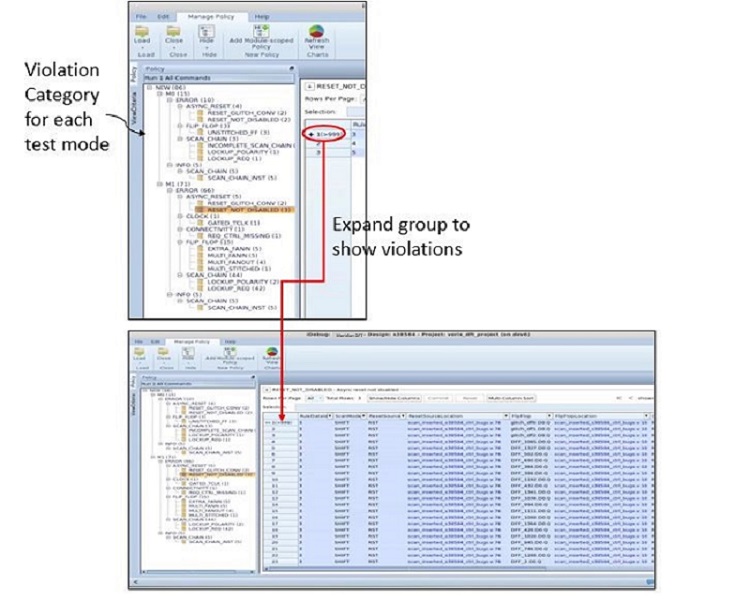
Multimode violation reports: Grouped by rules, rule category, severity, test mode & status
Debug: Custom Views & Waiver Tracking
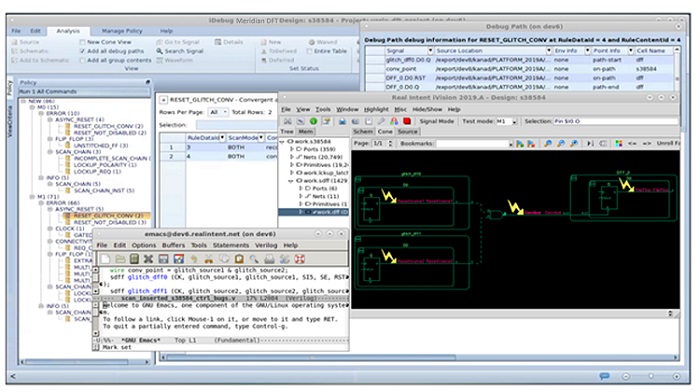
Integrated debug, with custom views & cross probing
Real Intent’s integrated iDebug debugging platform provides schematics to facilitate DFT violation debugging. It enables:
- Custom views & cross probes to the RTL design source via a source browser or the integrated Emacs editor
- Easy waiving and other status tracking; the waivers can be ported between runs
Meridian DFT also provides rule-specific debug information.
- Each Meridian DFT rule violation contains information to assist with debugging. For example, for an incomplete scan chain, the tool provides the debug path, as well as the forward and back trace in/out points.
Root-cause Analysis & Guidance Accelerates Debug
Meridian DFT provides precise, actionable reporting of violations, through multiple mechanisms, including:
- Labeling schematics with rule-specific debug information, such as labeling the glitch sources and the convergence instances in the schematic for reset glitch rule
- For path-based rule violations, listing the complete debug path from one end to the other
- Annotating test mode attributes on nets
- Creating customized report policies and filtering rule violations for additional precision
Meridian DFT provides precise user instructions and guidance on set up changes required to fix specific violations. For example, it identifies and recommends the source of the clock root to be specified as a test clock.
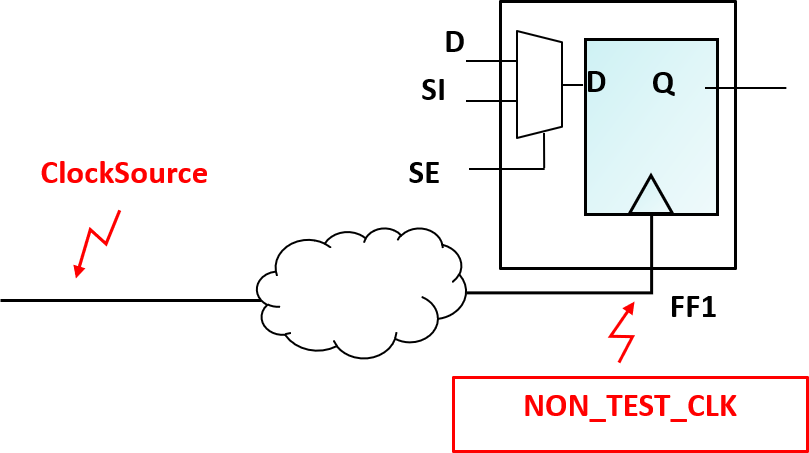
Recommends test clock specification
Fault Coverage Estimation Option
Meridian DFT has a fault coverage estimation option that estimates the fault coverage for each test mode to help the user assess readiness for sign-off.
The tool assesses the fault coverage for each test mode, with a rollup of overall scan test fault coverage estimation. It presents results as tables in the report and in the schematic.
The fault coverage tables include detailed coverage reporting for violating registers, design instances with the estimated highest number of uncovered faults, and selected test points per test mode.
The engineer can select coverage debug attributes for controllability, observability, and stuck-at-0/1 faults. Each table can be expanded and collapsed, with hyperlinks for cross-probing of nets and instances to the schematic or source code viewer as appropriate.
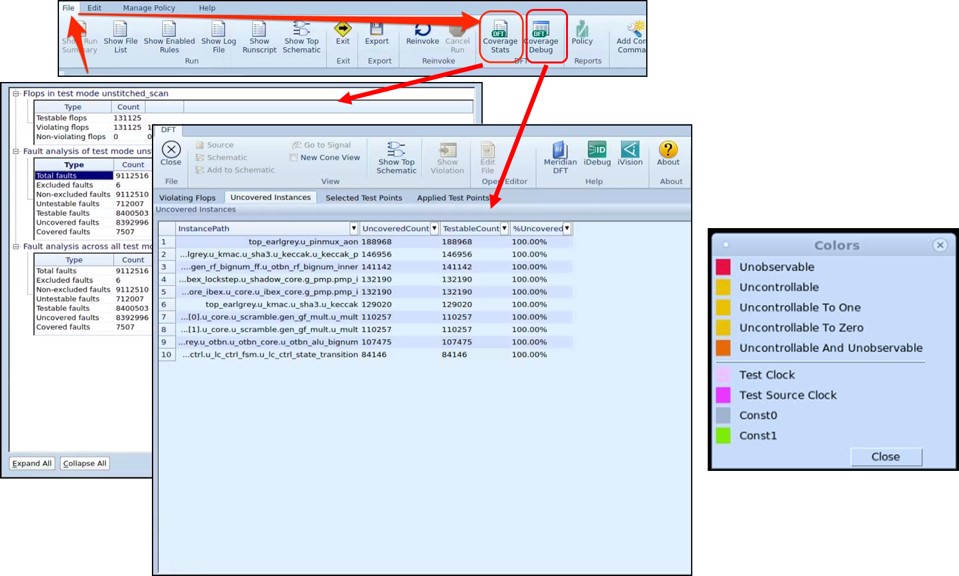
Unobservable and uncontrollable nets are color-coded
The tool can perform fault coverage analysis per test mode and will then annotate attributes for nets and instances in the schematic. The tool color codes unobservable and uncontrollable nets.
To further improve fault coverage, the engineer can use the tool to perform random-resistant fault analysis and recommend optimal control and observe test points in the design.
The schematic database tables include hyperlinks to cross-probe nets and instances in the schematic or the source code viewer.

